Sports Betting Analytics Software & Tools
Analyzing odds, statistics, and betting history is the main way you want to improve your profitability in sports betting.
Each approach has its advantages, weaknesses, and limitations.
Many bettors try only one way to optimize/analyze their betting strategies.
Successful bettors need to pay attention to every aspect of data analysis to succeed in sports betting in the long run.
While this can sound like a hard and complicated process, keep reading and you will find out why it is simpler than it seems.
What is the role of a sports betting analytics software?
Analytics software for sports betting can have multiple roles, including finding odds with a positive expected value, spotting mistakes in your strategy, and analyzing statistics.
After 10+ years of sports betting, I noticed that focusing on the overpriced odds has the highest payout.
While other approaches and betting systems can also offer long-term profits, exploiting wrong odds is the surest way to beat the bookies.
Another role of these analytics tools is to help you find the main reasons why your strategy is not performing as expected.
I was profitable with the strategy called value betting for many years, but I still had to face periods when I struggled to win.
These were the times when I had to analyze my betting history to find the main reasons behind my failure. Back in those days, my only tool was a simple Microsoft Excel spreadsheet.
While I succeeded in spotting the bad-performing markets and odds ranges, it took some time.
The methods I used to analyze my betting history are also implemented in the money management simulator and the analytics tool.
The third main role of a betting analytics service is to offer an interface where you can easily compare teams, and players by accessing statistics.
Analyzing sports-related statistics can help many bettors increase their winning rate if the data is correct and the user has a decent understanding of algorithmic betting.
What are the types of analytics tools for betting?
Based on my experience, I group betting-related analytics tools into four main groups: pre-game, post-game, odds-related, and statistics-related.
The main goal of analyzing matches pre-game or better said pre-bet is to spot opportunities that might have a +EV (positive expected value).
You use such software to analyze the statistics, compare odds, and conclude that a bet is worth placing or not.
Post-game analytics tools like Bet Metrics Lab have the role of spotting major mistakes, loopholes, and opportunities in your strategy.
While most bettors are focusing on finding good opportunities, they forget the importance of preventing themselves from falling into the same mistakes in the future.
Even the best value betting strategy can have major weaknesses that will lower the long-term potential.
Analyzing your betting history can help you find the odds ranges that are performing badly or teams that have a bad, losing period.
How do you analyze your bets to optimize your profitability?
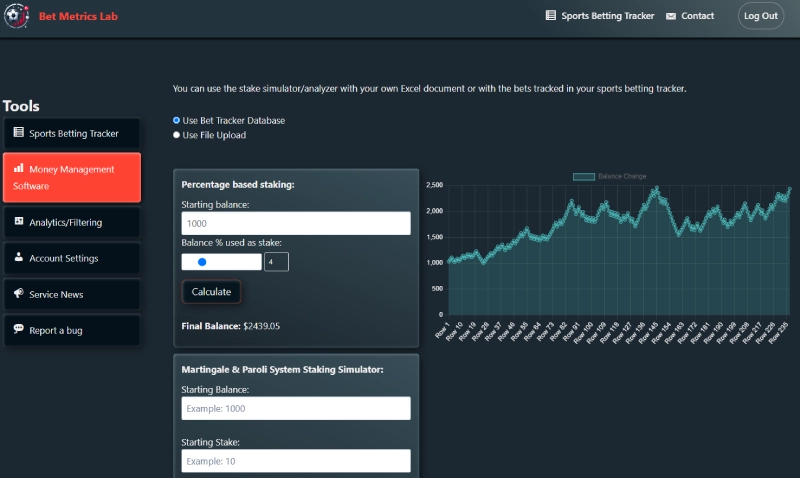
The main tools to analyze your betting history are the staking simulator and the filtering system.
To have the right picture of the main mistakes in your strategy, you will need a data sample with at least 300-500 bets.
Many bettors can be tempted to use a database with 50-80 bets, but that will do more harm than good.
To notice provable patterns in your strategy, you will need a database where the phenomenon called variance has very little role.
The main aspects you need to analyze:
- You have to simulate every possible money management scenario to figure out which approach would result in the highest returns.
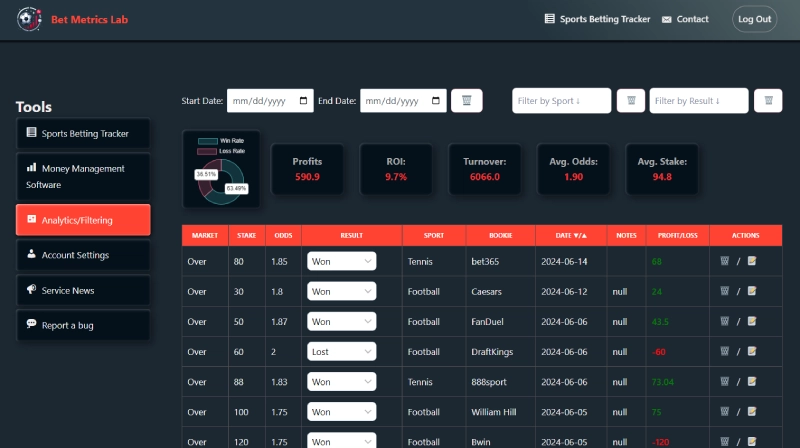
- Check which odds ranges have the highest and lowest ROI. This will help you exclude bad-performing odds.
- Use filters focusing on every possible aspect, including sport, and date range to spot the best-performing periods and events.
The information you gain from such filters and simulations will help you exclude future bets that have a high possibility of lowering profitability.
As an example, using the money management simulator will help you visualize how variance would cause swings when facing a long losing or winning streak.
After an in-depth analysis, you can notice that some low-risk methods such as using a smaller percentage of your actual betting balance will lower the risk of losing your whole balance.
However, it will also result in smaller long-term profits.
The main goal of using such sports betting analytics software is to maximize the profitability within your risk tolerance.
What are the downsides of such services?
Each type of betting analytics software has its downside such as the possibility of resulting in a conclusion made in error.
As an example, odds analysis tools often display betting opportunities that are no longer available or they do not hold any +EV. Spotting these fake/ghost betting opportunities requires at least a few months of experience.
Another weakness of value bet finders is the method they use to define the true odds of an outcome.
Using statistics-based analysis tools has even more downsides. The main one is not having the right quality and quantity of statistical database.
Many bookies have the advantage of having access to more accurate and up-to-date information about future sports events.
While bettors can have a massive database of historical data, they often lack fresh/hidden/insider information.
Using such services will most probably result in negative ROI in the long run.
This is the main reason why Bet Metrics Lab is not focusing on statistics-based predictions but on the analysis of betting history.
This approach does not have the advantage of providing new betting opportunities but helps you focus on the right type of bet.
What are the advantages of analyzing your bets?
Analyzing your bets/odds or sports events has the high potential of increasing the profitability of your strategy.
I know from experience that a simple Excel database of your bets can change a method from generating losses to being very successful.
Applying some filters to my basketball betting system helped me spot underperforming leagues and odds ranges. I was losing money on a strategy where I placed bets with 15% +EV.
The simple reason behind these losses was me focusing too much on Euroleague matches where I experienced too much inconsistency in the playstyle.
Right after ignoring matches from this league and focusing even more on others my long-term ROI skyrocketed to around +11%.