You must be logged in to use the staking simulator.
⚠️ Important Legal & Risk Disclosure
This page is for educational and analytical purposes only.
Betting laws and availability vary by jurisdiction.
Tools shown here do not guarantee outcomes or financial results.
How to use the stake management software?
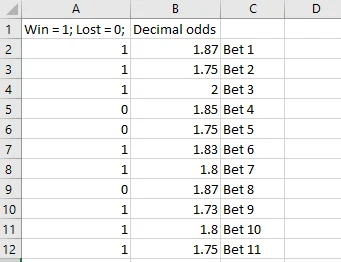
In case you do not have a ready-to-use betting history, below is a sample file that you can download.
This file has two roles: you can try this staking simulator right away and also use it as a guide on how to build yours.
Required data structure for accurate simulation:
- Column 1 records bet outcomes (1 = win, 0 = loss).
- Column 2 holds the odds for that specific outcome in a decimal format (European. Example: 1.85). I’m planning to implement a code for other formats too.
- Row 1 is for headers. Otherwise, the simulator will skip your first bet.
- Additional columns are ignored by the simulator.
Example:
A stake-sizing model analyzes historical betting data to visualize how different bankroll allocation rules would have affected balance behavior over time.
A bankroll framework simulator specialized in sports betting has the main role of helping bettors in decision-making and optimizing a strategy.
The simulator illustrates how different allocation approaches would have altered historical balance paths under varying risk assumptions. This process is achieved by analyzing how different odds ranges and stake sizes historically influenced drawdowns and volatility.
The money management simulator analyzes historical betting data and illustrates how different stake-management rules would have altered long-term balance behavior.
The model visualizes large balance swings, helping illustrate downside exposure and outcome dispersion. This feature itself can help bettors fine-tune staking strategies.
While using the staking simulator, users can adjust stake sizing to visualize how different approaches affect drawdowns and potential risk of capital depletion.
What are Max Drawdown and Sharpe-style ratio in staking simulations?
What it is:
The largest peak-to-trough percentage drop in your equity/balance curve. It answers: “What was the worst percentage fall from any high watermark to the next low before a new high?”
How we compute it (your code):
- We walk through the balance series, track the running peak, and for each point compute
drawdown = (balance - peak) / peak(a negative fraction). - We keep the most negative value; that’s the max drawdown.
- In the UI we show it as a positive % via
Math.abs(...).
Why it matters:
It functions as a downside-risk and capital-stress metric. Two allocation methods with similar historical balance changes can exhibit very different risk profiles if one has a -30% MDD and the other -8%.
Tiny example:
Balances: 1000 → 1050 → 990 → 1040 → 980 → 1000
- Peak is 1050; the worst trough after that is 980 → drawdown =
(980 - 1050) / 1050 ≈ -6.67%.
So Max Drawdown ≈ 6.67%.
Sharpe-style ratio (per bet)
What it is:
Risk-adjusted performance: average return per bet divided by the volatility (stdev) of returns per bet. Higher is better; 0 means no edge after volatility; negative means you’re losing on a risk-adjusted basis.
How we compute it (your code):
- Convert balances to per-bet returns:
ri=Bi−Bi−1Bi−1r_i = \frac{B_i – B_{i-1}}{B_{i-1}}ri=Bi−1Bi−Bi−1 - Compute the mean of rir_iri and the sample standard deviation of rir_iri.
- Sharpe-style =mean(r)stdev(r)= \frac{\text{mean}(r)}{\text{stdev}(r)}=stdev(r)mean(r).
- We treat the risk-free rate as 0 and do not annualize (so it’s per-bet, not per year).
- If stdev is 0 (no variability), we show “N/A”.
How to read it:
- > 1.0: stronger historical risk-adjusted performance per bet
- ~0.5: weak edge
- < 0: negative edge
(These are rough, sample-size-dependent heuristics.)
Tiny example (same balances as above):
Per-bet returns ≈ [+5.00%, −5.71%, +5.05%, −5.77%, +2.04%]
Mean ≈ 0.12%, Stdev ≈ 5.49% → Sharpe-style ≈ 0.022 (very small).
Quick notes
- Path-dependence: With percentage staking, MDD depends on the order of wins/losses.
- Sample size: Both metrics stabilize with more bets; short histories can be noisy.
- Scaling: If you ever want a per-100-bets or annualized Sharpe, we can scale by N\sqrt{N}N
Kelly’s criterion based stake calculation and simulation is not available in this software because that would need the Expected value calculated for each bet you placed.
What is a staking simulator software in sports betting?
A stake-sizing model software is an algorithm that is capable of analyzing a sports betting history. It also can calculate and visualize the profitability of a betting strategy.
With sufficient historical data, users can compare how different stake-sizing approaches would have impacted volatility, drawdowns, and balance stability.
It’s important to mention that staking software will display data and guides based on historical data. Bettors should not assume that this staking method will have the same result with future bets.
A staking simulator helps you understand your previous staking mistakes, but it can’t guarantee future profitability.
A bankroll framework software in sports betting is designed to help evaluate strategies and reduce unnecessary exposure to risk.
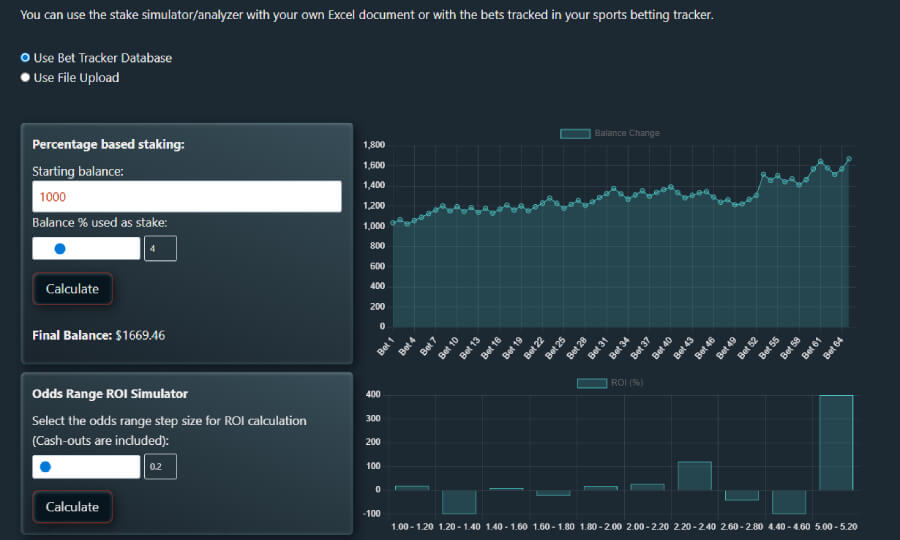
Percentage-based betting staking calculator
This sports betting calculator uses one of the most optimized ways a bettor can choose the stakes for each bet.
The first input defines the initial balance used for the simulation. This will be used as if it is a starting balance on your betting account.
With the second setting, you can set up the percentage you want to use for each bet in the following simulation.
When you are done, hit calculate, and the software will apply your staking strategy to the database you uploaded.
Adjusting the allocation percentage illustrates how balance trajectories differ under alternative exposure assumptions.
!Important to notice: for each new row (bet) the software uses the actual/updated balance, not the starting balance. So, if there is a lost bet, the loss is subtracted from the balance.
If the bet was a winner (with a value of 1 in the first column of the Excel), the profits are added to the balance, and the next stake is calculated based on that.
ROI analyzer for odds ranges
This simple tool allows you to analyze the ROI (return on investment) of certain odds ranges.
Example: if you want to find out if you were profitable on odds between 1.40 and 2.01, you just insert these values and hit the check ROI button.
Filtering results by odds ranges can highlight segments with persistently negative or neutral performance.
These calculations and analyses can help users identify inefficient betting patterns and avoid unproductive approaches.
Flat staking strategy simulator & ROI checker
Similarly to the tool above, this calculator also checks the profitability, and ROI of certain odds ranges.
What comes as an additional feature, is the ability to check the profitability of your betting history if you would use a flat stake for each bet.
A flat stake means using the same stake for every bet, no matter if the previous bets were winners or not.
Martingale staking software
The Martingale stake-sizing model is based on the basic rule that every time you lose a bet, the stakes on the next bet are doubled.
If you face a longer losing streak, the stakes are doubled until you have a winning bet. After a winning bet, you return to the starting stake.
Even strategies with positive historical outcomes can experience severe drawdowns under exponential stake progression.
The main goal of testing this money management strategy is to illustrate the structural risk of rapid capital depletion.
By lowering the starting stake, users can reduce the likelihood of severe drawdowns during extended losing streaks.
Reverse Martingale: Paroli System Staking Simulator
The Paroli System is the complete reverse of the above-mentioned Martingale strategy. In theory, it is designed to amplify exposure during winning streaks, which also increases downside risk.
The main idea behind this system is to double the stakes every time after winning a bet and return to the starting stake after a losing bet.
It has a greater advantage when the odds are above 2 (decimal). As you can see from the simulation, in most cases it will result in slow but simulations frequently show unfavorable long-term balance behavior due to compounding exposure.
How can historical simulations be compared?
To evaluate different approaches, users can test historical data across multiple stake-management settings to compare risk and outcome distributions.
Are these betting stake-sizing models accurate?
The simulator reproduces historical balance behavior based on the supplied data and selected allocation rules. Differences in simulated outcomes arise from how each money-management method handles risk, variance, and drawdowns.